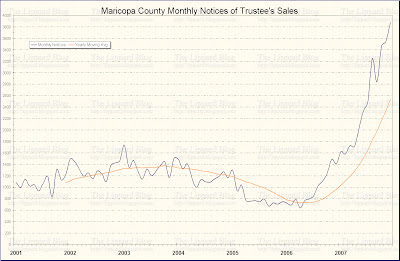
By now it’s barely even newsworthly that December saw another record number of notices of trustee’s sales in Maricopa County (3875, which was more than 300 higher than last month’s record high, which was almost 100 higher than October’s record high, which was roughly 200 higher than August’s record high…).
For some extra context and excellent commentary, after looking at the graphs…
<img style=“display:block; margin:0px auto 10px; text-align:center;cursor:pointer; cursor:hand;” src="/images/07DecNTR.jpg" border=“0” alt=“Maricopa County Notices of Trustee’s Sales - Click to Enlarge"id=“BLOGGER_PHOTO_ID_5150299145537480498” />
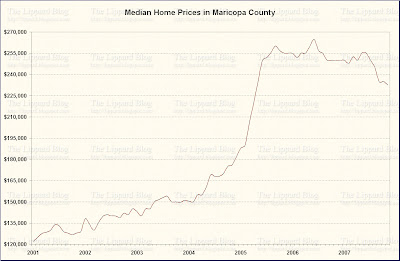
<img style=“display:block; margin:0px auto 10px; text-align:center;cursor:pointer; cursor:hand;” src="/images/07DecMed.jpg” border=“0” alt=“Maricopa County Median Home Price - Click to Enlarge"id=“BLOGGER_PHOTO_ID_5150299506314733378” />
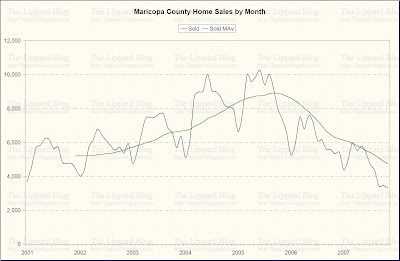
<img style=“display:block; margin:0px auto 10px; text-align:center;cursor:pointer; cursor:hand;” src="/images/07DecSold.jpg” border=“0” alt=“Number of Homes Sold Per Month in Maricopa County - Click to Enlarge"id=“BLOGGER_PHOTO_ID_5150299845617149778” />
…I recommend you check out Mish’s Pent Up Housing Demand, and the NYT’s Sound of a Bubble Bursting.
Historical Comments
Where did you get these graphs? (What is the public site that has them?) I would like to search that database. Thanks.
I make the graphs in Excel using raw data I pull from the Maricopa County Recorder's Office and the Arizona Regional Multiple Listing Service.